High School Graduation Rates
Statewide Takeaways
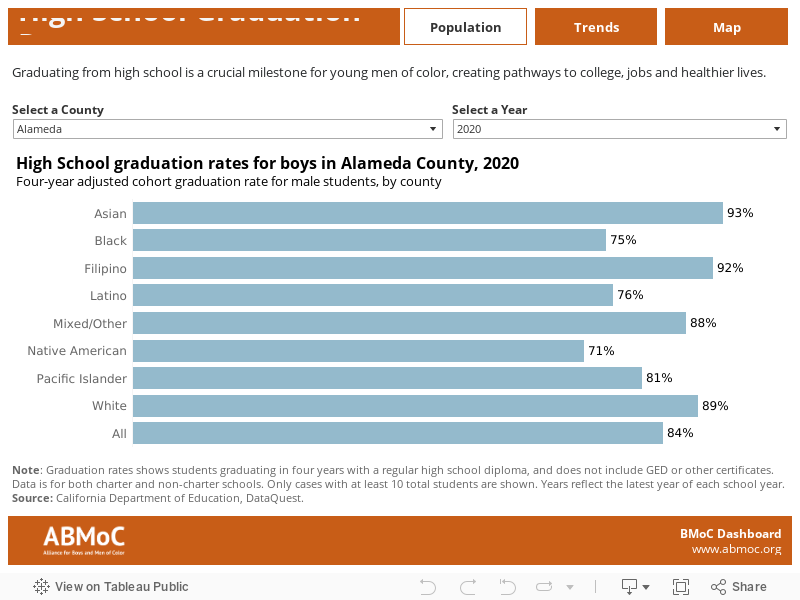
Eight-in-ten (81%) high school boys in California graduated on time in 2020. But across the state, Black and Indigenous boys are most-often failed by school systems and have lower graduation rates than white and Asian students.
Sources:
1. “School Poverty.” National Equity Atlas, 2018.
2. “Suspending Our Future.” Black Minds Matter Coalition, 2021.
3. “Is Your State Prioritizing Teacher Diversity & Equity?” The Education Trust West, 2019.
Poverty Rates
Poverty Rates
In 2019 almost half (48%) of boys of color ages 5-17 lived in poverty. Black and Latino boys experience the highest levels of household poverty, compared to white children.
Unemployment Rates
Unemployment Rates
In 2019, 14% of young men ages 16-24 were unemployed across California. Black (26%) and Native American boys (23%) faced the highest unemployment rates compared to other groups.
Degree Completion Rates
Only a quarter (25%) of men of color held a bachelor’s degree or higher in California in 2019. White men, by comparison, are almost twice as likely (44%) to have a college education or higher.
High School Graduation Rates
Eight-in-ten (81%) high school boys in California graduated in time in 2020. But across the state, Black and Indigenous boys are most-often failed by school systems and have lower graduation rates than white and Asian students.
College Readiness Rates
Statewide, less than half (47%) of high school boys of color graduate high school meeting the entry requirements for the UC/CSU systems.
Youth Mortality Rates
Across California, Black and Native youth had the highest mortality rates in 2019. Both Black and Native youth are twice as likely to die between ages 1-24 compared to white youth.
Learn how to use all the features in this dashboard here.
Related Resources
DataQuest (CA Dept of Education)
Black Teachers Improve Outcomes for Black Students (usnews.com)
No Police in Schools: A Vision for Safe and Supportive Schools in California (aclusocal.org)
Police Presence in Schools Does Not Increase School Safety and Harms Students of Color (SchoolDisciplineData.org)
Community Schools Toolkit (futureoflearningca.org)
Methods and Notes
Graduation rates show the percentage of students completing a high school diploma in California schools. The four-year adjusted cohort graduation rate (ACGR) is calculated as the total number of high school graduates divided by the total number of students in that graduating cohort. Schools include both charter and non-charter programs. Data was obtained from the California Department of Education’s DataQuest database. Years shown reflect the last year of the school period.
Race and ethnicity data are shown as reported by the California Department of Education. These data report Asian and Pacific Islander categories differently from other indicators in the dashboard. “Asian”, “Filipino” and “Pacific Islander” categories were left separate to allow for more comprehensive analysis and comparison of rates.
Only cases with at least 10 students are shown. Graduation rate data is only shown after 2017 due to changes in the CDE’s cohort methodology. Percentages are rounded to the nearest whole number. Totals may not add to 100% due to rounding. Latinos include people of any race.
Please see here for additional notes on the BMoC Dashboard and its methodology.